Musings

Liquid Leak
Posted on March 02, 2016
Excerpts from The Economist (www.economist.com) Buttonwood Blog, “Liquid Leak; Can weak markets be explained by changes in bank balance-sheets?” published February 20, 2016.
“ECONOMISTS have been a bit puzzled by the market turmoil of early 2016. It seems to be driven, in part at least, by fears of either an American recession, or a sharp Chinese slowdown, neither of which looks likely from the data. Perhaps the answer to the conundrum is that market movements are not being driven solely by fundamentals but by recent developments in market liquidity.”
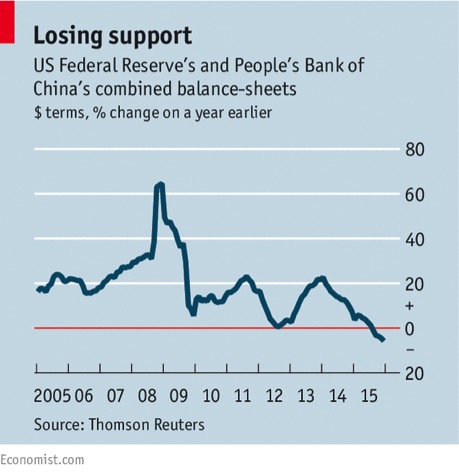 “CrossBorder Capital, a research firm, says that the combined balance-sheets of the Federal Reserve and the People’s Bank of China were growing at more than 10% a year for much of the past decade—and reached a peak of 64.5% growth in 2008. But over the past year, they have actually contracted (see chart). Both the European Central Bank and the Bank of Japan are still adding assets, of course. Nevertheless, CrossBorder’s global liquidity index, which reflects changes in the balance-sheets of a range of central banks, has fallen to 35; a world recession, says the firm, is signalled when the index drops below 30.”
“Another sign that liquidity is shifting can be seen in the world of exchange-traded funds (ETFs)—portfolios of assets that can be traded on the stockmarket. According to BlackRock, which operates the biggest high-yield ETF, daily trading in the fund was briefly worth a quarter of the value of all American corporate-bond trading in December. Buying and selling an ETF has become a more liquid way of shifting an investor’s asset allocation.”
“Since the crisis commercial banks seem to have retreated from their market-making role. The impact of this shift has been disguised by the huge amounts of liquidity injected by central banks. But as central banks scale back their support, the underlying investors (pension funds, insurers, hedge funds and the like) will have to rely on each other to act as willing buyers and sellers. That seems highly likely to result in more volatile markets than in the past, especially when the outlook for the economy is unclear. Buckle up.”
David Stockman Observations
Posted on February 19, 2016
David Stockman has some interesting views about which we thought you might like to read. He is quite bearish in general, but some of his specific observations are interesting. None of these opinions and forecasts affects what we do, but we still like to be in touch with some of these nerdy observations. Here are some excerpts/charts posted on DavidStockmanContraCorner.com.
From David Stockman Interview on Turbulent Financial Markets: “There’s A Train Wreck Coming” Posted August 13, 2014:
“Train wreck is a pretty good term to describe what is coming. But this train wreck isn’t simply going to hit a wall out of the blue. Actually, it has been forming and accumulating and expanding for many years now, and yet it has simply been ignored, particularly by the financial markets which have ridden this bubble to these extreme and historic heights.”
“But when you take the balance sheet of the Fed from $900 billion to $4.5 trillion in less than 70 months, and when that pattern is replicated around the world, that is a train wreck in slow motion. The only issue is, when does it hit the wall? The answer to that question is it’s not very far down the road, and I can promise you that is when all hell is going to break loose.”
From “Why The Bulls Will Get Slaughtered” Posted February 6, 2016:
“At the end of the day, the monthly jobs report is an economic sideshow. The nonfarm payroll part of it, in particular, is a relic of your grandfather’s economy when most jobs represented 40-50 hours per week of paid employment on a year round basis.”
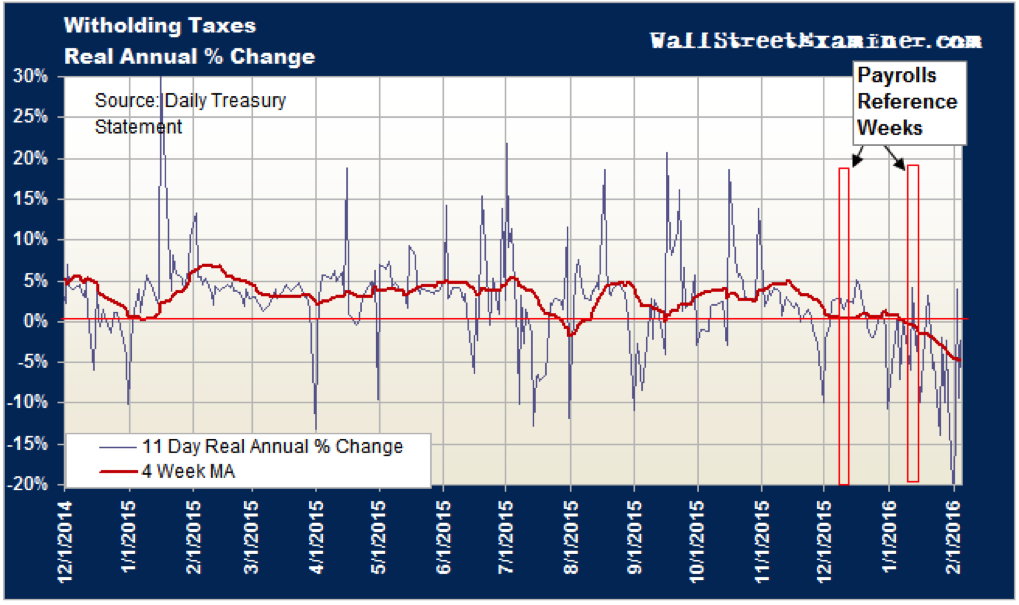
“And if we need aggregated data on employment trends, the US government itself already publishes a far more timely and representative measure of Americans at work. It’s called the treasury’s daily tax withholding report, and it has this central virtue: No employer sends Uncle Sam cash for model imputed employees or for 2.1 million seasonally adjusted payroll records that did not actually report for work.”
“In fact, his (colleague Lee Adler) latest report as of February 6th indicates that, The annual rate of change in withholding taxes has shifted from positive to negative. It has grown increasingly negative in inflation adjusted terms for more than a month. Following on the heels of a weak December, it is a clear sign that the US has entered recession……..the implied real growth rate is now roughly negative 4.5% per year……it is the most negative growth rate since the recession. It follows the longest stretch of zero growth in several years, This can no longer be considered temporary or an anomaly. It has all the earmarks of a trend reversal and is getting worse.”
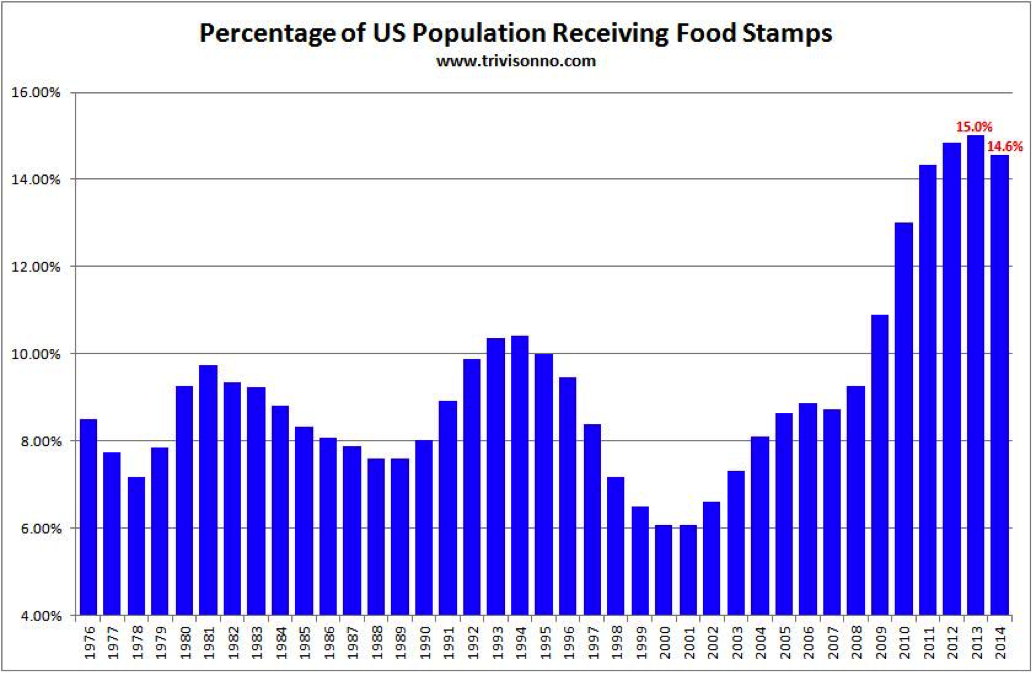
“Food stamp participation rates are still the highest in history, and bear no resemblance to where these ratios stood during earlier intervals of so-called full employment. In a word, 4.9% unemployment can’t be true in a setting where the food stamp participation rate is nearly 15%.”
About David Stockman-
He became Director of the Office of Management and Budget under President Ronald Reagan, serving from 1981 until August 1985. After leaving government, Stockman joined Wall Street investment bank Salomon Bros. He later became one of the original partners at New York-based private equity firm, The Blackstone Group. Stockman left Blackstone in 1999 to start his own private equity fund based in Greenwich, Connecticut.
For additional information go to: davidstockmanscontracorner.com
Market Volatility
Posted on January 15, 2016
With the enormous amount of volatility in the markets lately, many clients have asked what we think is going to happen. Well… we are definitely certain that we have no idea. We do not speculate or prognosticate. We let our proprietary models tell us when to be in or out of the multiple asset classes in which we invest. Having said that, in looking at the charts, from a traditional, technical perspective, we would suggest looking at the lows of August, September and October and seeing if those lows are significantly breached to the downside. If they are, many technical analysts would suggest that there is a long way down yet to come. If they are not, there might be a reversal to the upside. Keep in mind that these are only our musings and are in no way projections.
It appears to us that this market volatility may be in great part due to traders. For example, on a day when the market is up, it is up more in the morning and less in the afternoon. When early buying moves the market up, the pullback towards the close hints at traders taking profits. On days when the market is down, it is down more in the morning and down less at the close. This suggests to us that traders are going short early in the day and covering those shorts at the end of the day, creating “buying” by definition. It seems to us that conventional market participants have not yet made any significant moves to sell, which may or may not turn out well.
Oil Slump
Posted on January 15, 2016
We were thinking about the dramatic drop in oil prices from over $100 a barrel to under $30. Other commodity prices, like iron and copper, have also tumbled. We believe that there is a slowdown in Chinese manufacturing and construction that has led to these steep declines. Analysts seem to be all over the place with their oil price projections. Some are saying below $20 and others are saying over $60. We, of course, have no idea but are wondering where price increases could come from. Some people say that the solution to low prices is low prices, and that because prices are low, demand (or buying) will be forthcoming. As we look at the world, we see some very troubling issues. Russia’s revenue is overwhelmingly oil based. Mr. Putin is spending substantially on defense, and we think it would be difficult for Russia to reduce its costs. Saudi Arabia subsidizes the costs of fuel and electricity to its citizens. That subsidy has recently been reduced. Brazil has all kinds of political issues and rising inflation. With sanctions about to be reduced in Iran, substantial additional oil production may be coming into the marketplace. We, therefore, presume that the major oil producers in the world, aside from the United States, can’t afford to reduce production. Several Middle Eastern producers are low cost producers and can break even at these levels. The United States’ break-even is thought to be north of $50 a barrel. However, that includes the cost of drilling. Once the well is in the ground, the extraction cost is relatively low. So from a supply perspective, it seems to us, a reduction is unlikely. Much of the recent commodity boom was created by China. With China assumptively slowing down, where will the demand come from? We think the only country with enough population to matter is India, but it doesn’t appear as though politically or culturally, anything like China is likely to occur anytime soon. If we were involved in commodities, and, by the way, we are not, we think we would be quite concerned.
CMA has relied upon information provided by sources deemed to be reliable & is available upon request. Sources may include Gemini Fund Services, Morningstar, Bloomberg, Barron’s, CNBC, Yahoo, Marketwatch and The Economist. The data herein is not guaranteed.